
Offer 5,00$ discount

Offer 5,00$ discount
Get Offer.png)
Chart patterns are one of the most essential tools in technical analysis, helping traders analyze price movements and predict future trends in financial markets such as forex, stocks, and cryptocurrencies.
These patterns emerge as a result of price fluctuations over time and help traders identify potential buying and selling opportunities. In this article, we will explore the most common types of chart patterns, leaving space for you to insert images for each pattern.
📌 Definition:
Chart patterns are specific formations created by price movements on a price chart, providing traders with signals about future market direction—whether the price will continue its trend or reverse.
📌 Why Are Chart Patterns Important?
✅ Help traders predict price movements based on historical data.
✅ Provide clear buy or sell signals.
✅ Allow traders to make well-informed trading decisions.
🔹 Reversal patterns indicate that the current price trend is likely to change. If the market is in an uptrend, these patterns suggest a potential downtrend, and vice versa.
📌 Definition:
The double top is a bearish reversal pattern that forms when the price reaches a high level twice, but fails to break through, leading to a downward movement.
📌 How to Identify It?
.jpeg)
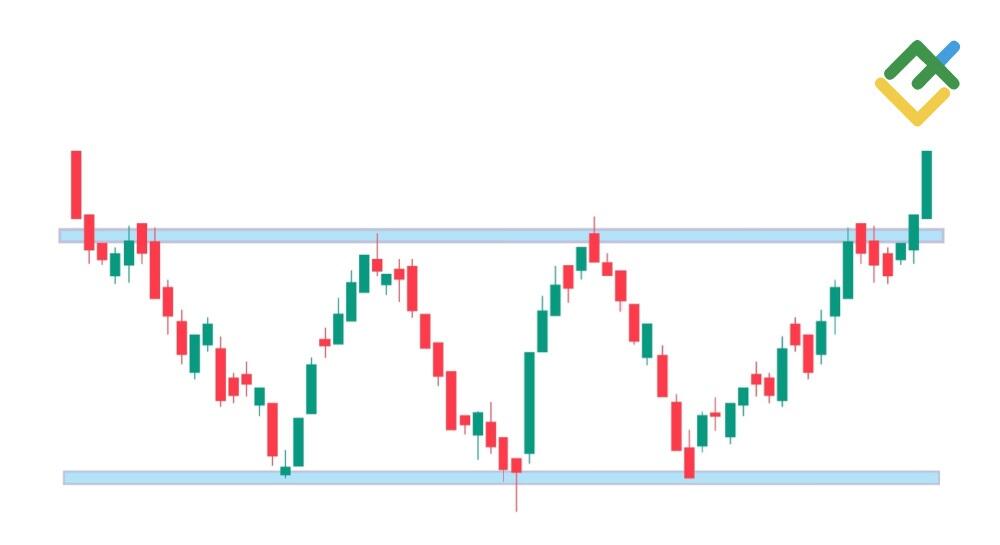
📌 Definition:
The double bottom is a bullish reversal pattern that occurs when the price reaches a low level twice but fails to break lower, indicating a potential upward trend.
📌 How to Identify It?
.png)
📌 Definition:
The head and shoulders pattern is one of the most reliable reversal patterns, and it can be either bearish or bullish.
📌 Types:
.jpeg)
🔹 Continuation patterns indicate that the current price trend will continue after a short pause or consolidation period.
📌 Definition:
The ascending triangle is a bullish continuation pattern that occurs when there is a horizontal resistance level and a rising support level, suggesting that buyers are gaining control.
📌 How to Identify It?
.png)
📌 Definition:
The descending triangle is a bearish continuation pattern that occurs when there is a horizontal support level and a declining resistance level, indicating that sellers are gaining control.
📌 How to Identify It?
.png)
📌 Definition:
🔹 Bullish Flag: A brief consolidation phase within an uptrend before the price continues higher.
🔹 Bearish Flag: A brief consolidation phase within a downtrend before the price continues lower.
📌 How to Identify It?
.png)
.png)
Chart patterns are powerful tools that help traders identify potential price movements and make strategic trading decisions. However, for higher accuracy, traders should combine chart patterns with technical indicators such as volume, moving averages, and support/resistance levels.
📌 In the next article, we will explore how to use chart patterns in trading strategies!
